GIS Day Explores the Importance of Increasing Urban Forests in Louisville
November 26, 2025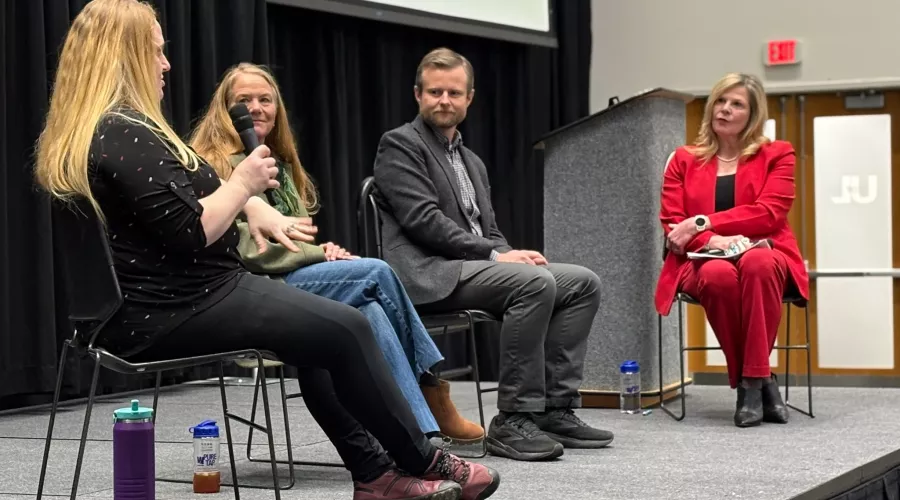
By Stephanie Godward, Communications and Marketing Director, College of Arts & Sciences
UofL's Center for Geographic Information Sciences held its annual GIS Day last week, featuring Louisville’s leading experts who are working together to increase the city’s urban forests, specifically with an eye on increasing equity for neighborhoods lacking tree canopy cover.
This lack of canopy cover creates both negative health issues and increased energy costs among other problems, while increasing the number of trees within a specific area can have multiple positive impacts on health and wellbeing.
GIS stands for Geographic Information Systems (or Sciences), which is defined as the study and use of technology to understand “where things are” and “why they are there.” It combines maps, computers, and data to help people to see patterns and solve real-world problems tied to location. For example, GIS can help people to track how a disease spreads in different cities, where new roads, schools, or hospitals should be built, to study how climate change affects certain regions – and more. In simple terms, GIS helps people make smart decisions by showing how geography and data connect.
“Seeing the Forest for the Trees: Mapping Health in Urban Landscapes,” was the theme for this year’s GIS Day, with featured speakers including:
- Ray Yeager, an alumnus of UofL’s Department of Geographic and Environmental Sciences and an active collaborator on UofL School of Medicine’s Green Heart Louisville project, University of Louisville Superfund Research Center projects, and the Louisville Healthy Heart Study
- Cindi Sullivan, Executive Director/President of TreesLouisville
- Megan Hale, GIS Supervisor for Louisville Parks and Recreation: Urban Forestry
Dean Dayna Touron welcomed the 140 attendees as DJ Biddle, Director of the Center for GIS, opened the day.
“This is such an important event, and it is so critical to our dedication and status as a community engaged institution that we have so many people from our local and regional community with us here today,” Touron said. “Each year, this global event reminds us of the extraordinary power of Geographic Information Science, to help us understand our world and importantly, to improve it.”
Laura Krauser, GIS Research Coordinator at UofL’s Center for GIS, shared her thoughts on the impact this tool and its data can have on communities.
“Louisville is so rich with stories about our neighborhoods, our green spaces, and the people who care about them. Today, we get to see those stories come to life through the power of GIS,” she said.
Yeager served as the first speaker of the day and connected GIS to the importance of improving the overall health and wellness for entire communities across Louisville and beyond. As he showed a map outlining the wastewater system of Louisville, he explained how these maps impact the decisions that impact citizens.
“At UofL’s School of Medicine, the use of GIS enables us to look at systems like this, like it was the veins of an organ, but it’s the veins of our city. When we want to learn something about health, this gives us a new tool to evaluate this,” Yeager said. “During the COVID pandemic, we used GIS to decide where to take wastewater samples to figure out what rates of COVID were in the city.”
This then informed where to sample further to make sure the city was represented equitably in the data, which then informed where certain needs were higher for vaccine sites and screening sites.
Yeager also uses GIS for climate change research to discover how it is impacting health. This helps to determine who is impacted the most – leading to actions steps, and answers for what can be done to address it.
Yeager also shared how his team uses GIS to evaluate urban forests through the Green Heart Project, which impacts all aspects of overall health for the community. The Green Heart Project through UofL's School of Medicine shows real world implementation of a green space and health project, measuring heart health, kidney health, mental health and more, while planting thousands of trees to see what would happen to the people enrolled in the study.
“One capability GIS gave us is the ability to better evaluate green spaces themselves,” Yeager said. “We can measure the urban forest in unprecedented ways and measure how those attributes play a role in health outcomes, how it’s reducing pollution, how it’s reducing heat, or noise.”
He shared the growth and impact of a single planted tree named “Unique” by one community, and the impact that tree has had on a schoolyard over the last several years, showing how children gather and play under the tree, and how it increases shade and oxygen.
Sullivan spoke directly about how GIS can pinpoint historical inequities that remain today, so that the city and its partners can take action to change it.
“I said for decades that the red lined neighborhoods in Louisville from the 1930s have lower canopy than the green lined areas, and then when we got a GIS professional at Trees Louisville who analyzed the data – we now know that today in 2025, the areas that were red lined in the 1930s have an average of 21 percent tree canopy,” Sullivan said. “The green lined areas have an average 48 percent tree canopy. There’s the data. That’s what we need to tell the story.”
Redlining is the now illegal practice of denying financial services, like mortgages and loans, to people in certain neighborhoods based on their race or ethnicity, regardless of their individual qualifications. Its impacts continue in neighborhoods across Louisville today, as proven through data collected through GIS.
Hale also discussed the impact GIS has in making progress to address these issues.
“Over four years, our team has added 25,000 planting sites and 12,000 planted trees,” Hale said. “Dashboards let us visualize and track, import progress in real time, while apps help us to share maps for contractors and planting partners.”
Trisha Brush, who serves as the Director of the Louisville/Jefferson County Information Consortium (LOJIC), leads the consortium’s mission to deliver high-quality geospatial data and technology services for Louisville Metro and its partner agencies.
Brush led a panel discussion involving all of the speakers at the end of the program, as speakers also took questions from the audience in closing.
Biddle said that reflecting on this year’s event, the thing that brings him the most joy is seeing how GIS Day at UofL has grown to reach so far beyond Belknap Campus over the years.
“Each edition draws new community members to campus, sparking new connections and conversations, and broadening the coalition of people who see how geospatial technology is an essential tool for addressing the grand challenges we are all working to overcome,” Biddle said.
Related News